Using the SimpleReport Template
TuringTrader's reports are based on customizable templates. As the default go-to template, we recommend using the SimpleReport template included with the distribution. In this article, we describe how to use the template and explain how to interpret the charts.
Creating the Default Views
In Demo 01, we have seen how to create simple charts with TuringTrader, based on the SimpleChart template. Using SimpleReport works almost the same way, with only very few specialties to consider.
SimpleReport looks at the first chart sent to a given Plotter object to create all of its default views. This chart must follow a specific format:
- The x-axis must be of
DateTimeformat, most likely derived from the simulator's SimDate. - The first data column must be the strategy's value, most likely derived from the simulator's NetAssetValue.
- The second column is optional. However, we recommend adding a benchmark here; for many strategies, this is the S&P 500 Total Return Index.
Here is some example code:
Plotter.SelectChart("My First Chart", "Date");
Plotter.SetX(SimDate);
Plotter.Plot("Trading Strategy", NetAssetValue);
Plotter.Plot("S&P 500", Asset("$SPXTR").Close[0]);
Please note the following:
- The names of the chart and x-axis, "My First Chart" and "Date" in the example, are ignored and won't be visible anywhere.
- The names of the data columns, "Trading Strategy" and "S&P 500" in the example, show up in the chart legends, and the column header of the metrics table.
Default Views
From the single chart sent to the Plotter object, SimpleReport creates multiple pages, the default views.
Equity Curve with Drawdown
After running a backtest, the first thing most developers are interested in is the equity curve. That’s why this is the first page we show, just like most other backtesting engines do. The chart provides a quick overview of the strategy’s performance and risk:
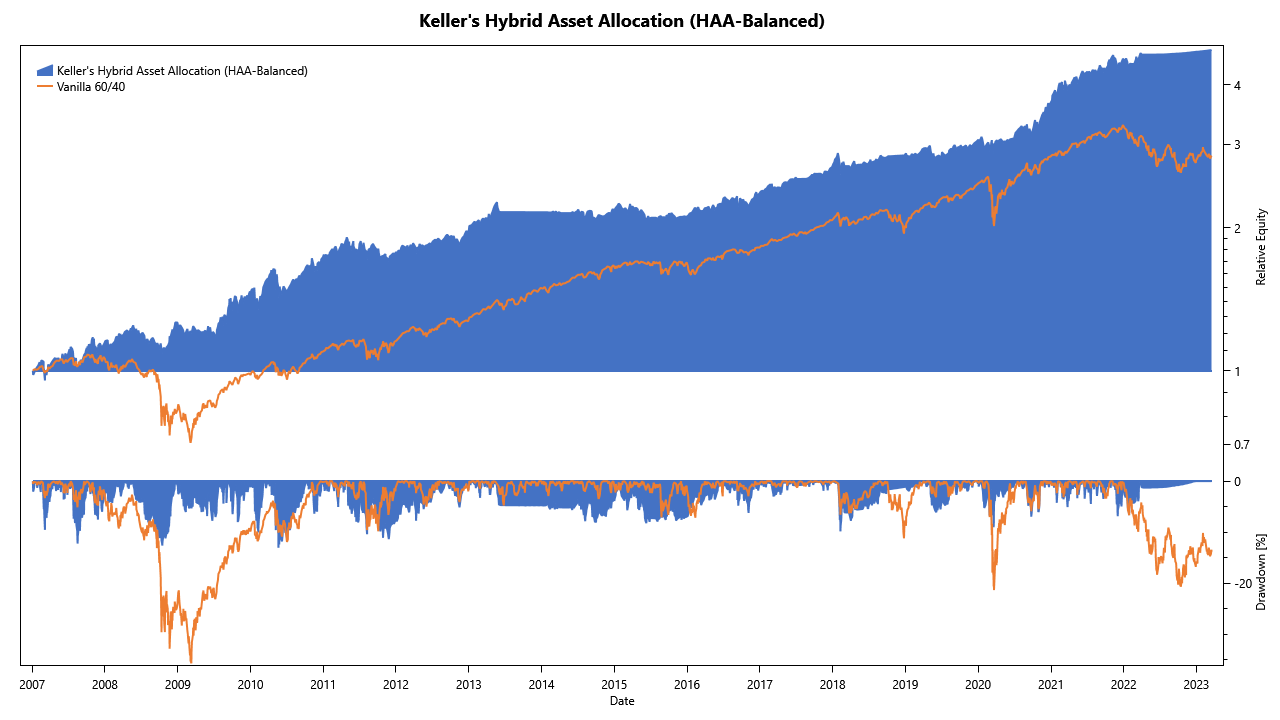
The chart has the following characteristics:
- The equity curves for the backtest and the simulation are scaled, such that they both start with a value of one on the leftmost date.
- The equity curves are plotted on a logarithmic scale. Doing so makes it easier to spot irregularities in the strategy's return, and to compare the strategy's performance to the benchmark.
- Below the equity curve, the drawdown is shown as an underwater chart. The drawdown at the leftmost date is always zero, which may be misleading.
Performance Metrics
After you’ve had your first visual impression of the strategy’s behavior, it is time for cold facts. The performance metrics page shows a selection of commonly used performance metrics:
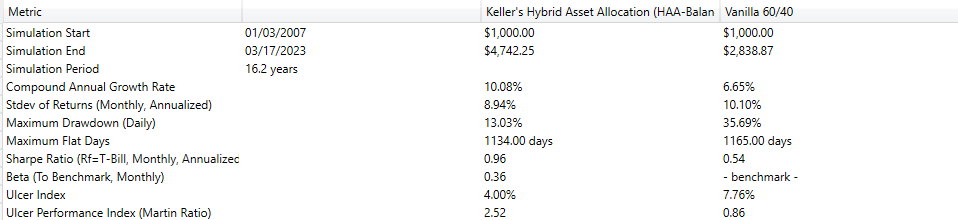
Please note the following:
- The Standard Deviation of Returns is based on monthly returns and then annualized.
- The Sharpe Ratio is calculated on monthly returns and then annualized. As the risk-free rate, the template uses the 3-Month Treasury Bill Rate.
- Beta is calculated between the strategy and its benchmark.
Annual Performance
Many investors like to think about their assets in terms of yearly returns. Therefore, we provide a page with annual columns showing the returns:
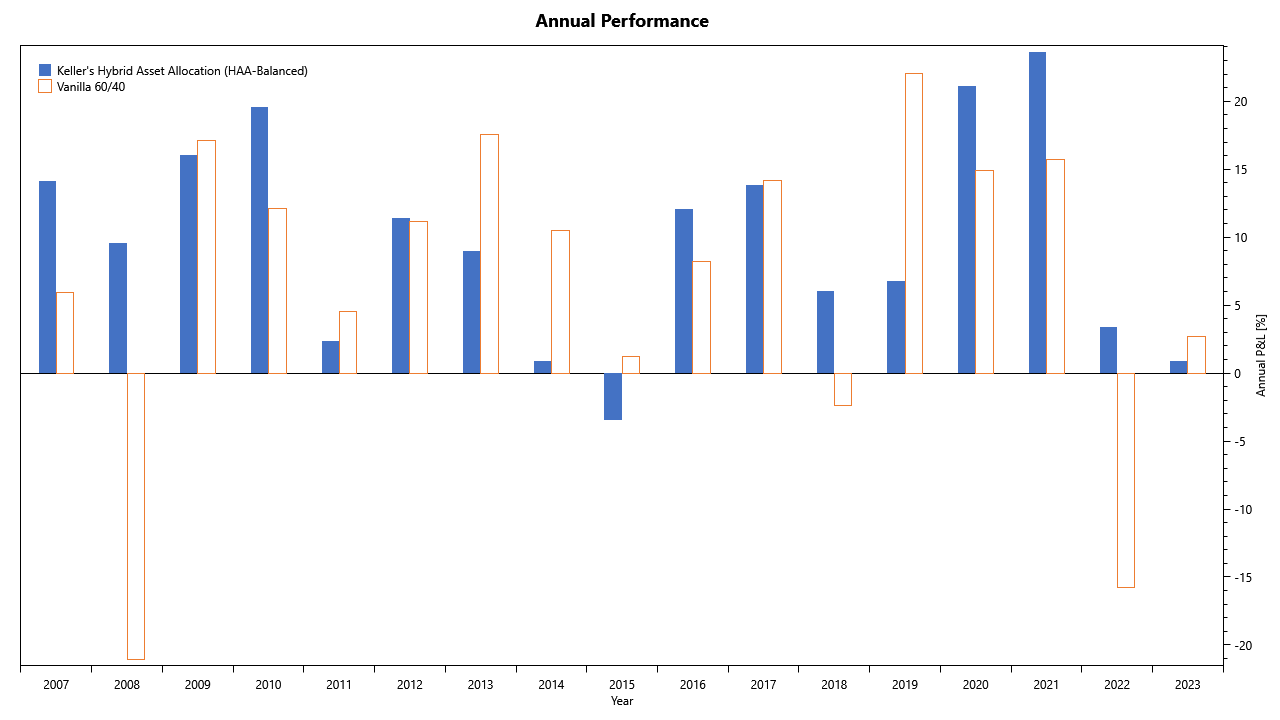
Some notes:
- The leftmost and rightmost columns are likely to show partial years. The chart does not annualize these but assumes that the returns in these columns are for the whole year.
Monte Carlo Analysis
Monte Carlo Analysis takes a given distribution function, reshuffles the returns in time, and creates a large number of “parallel universes” with their alternative realities. Then, it runs statistics on these alternative results.
TuringTrader takes this one step further, and calculates the corridors of likely annualized returns, charted over time. Especially the pessimistic outcome, the 5th percentile at the bottom of the corridor, provides deep insight into the risk/ return characteristics of trading strategies.

The bottom of the chart shows how deep drawdowns during a recession might pan out. These results are significantly more relevant than maximum drawdown figures, as they are estimated with at specific percentiles, making a comparison between strategies less dependent on timing luck.
Monte Carlo analysis is an invaluable tool to have, as it helps to identify statistical flukes and develop more robust strategies. TuringTrader's unique and novel charts are a step above other backtesting tools.
Rolling Returns
When evaluating trading systems, rolling returns are particularly useful. Especially when compared to a benchmark, these charts allow to easily spot outperformance, underperformance, and correlations.

The bottom of the chart shows how the strategy is tracking relative to its benchmark. A strategy that is outperforming has a positive slope, while periods of underperformance have negative slopes. Similar to the rolling returns, this chart helps to judge a strategy's outperformance or underperformance.
Optional Views
Target Asset Allocation
The target asset allocation can be added to the chart with a single line:
Plotter.AddTargetAllocation();
This will add a table with the simulator's last asset allocation, which is required for any strategy that you want to trade live. The table will show tradeable assets, even when creating strategies of strategies. Read our article about child strategies to learn more.

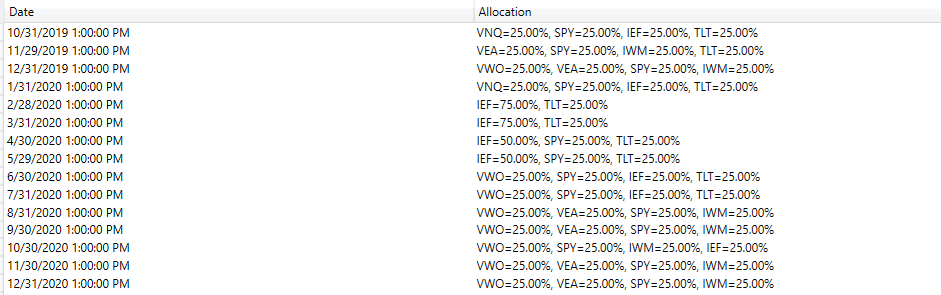
Historical Asset Allocations
The historical asset allocations can be added to the chart with this line:
Plotter.AddHistoricalAllocations();
This will add a table with the historical asset allocations throughout the simulation. Like above, the table will show tradeable assets, even for strategies of strategies.
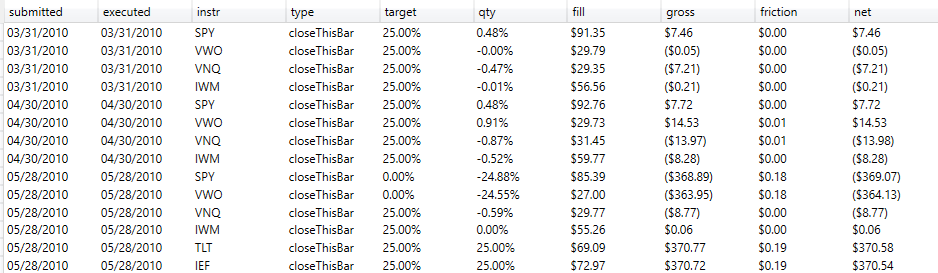
Trade Log
The trade log is added to the report with the following line:
Plotter.AddTradeLog();
This will add a table with every single trade executed, including date, order type, fill price, and friction:
Adding Custom Charts and Tables
While the default views are very useful, we are aware that developers of strategies always want more. The SimpleReport template allows adding any number of strategy-specific charts or tables to address this need. Doing so works precisely as shown in Demo 01