Demo 01: Calculating Indicators
Developing trading strategies with TuringTrader is straightforward. And while the use of C# creates a slightly steeper learning curve and might at first be intimidating for some, this effort will be very rewarding in the longer run.
In this article, we demonstrate the following techniques:
- Basic algorithm structure
- Simulation range
- Processing bars and trading calendar
- Importing asset quotes
- Calculating indicators
- Accessing time series data
- Creating custom charts
Before We Start
Each article in the quick start guide is accompanied by demo code. This allows you to follow along, and experiment with the code. In our opinion, this is the best way to familiarize yourself with a new API.
To get started, do the following:
- Install TuringTrader from the binary installer
- Launch the TuringTrader application
- Load the demo by clicking
File / Algorithm / Demo Algorithms (V2) / Demo01_Indicators.cs - Open an editor with the file by clicking
Edit / Algorithm Source
Basic Algorithm Structure
The most simple TuringTrader algorithm we can write looks like this:
using TuringTrader.SimulatorV2;
using TuringTrader.SimulatorV2.Indicators;
using TuringTrader.SimulatorV2.Assets;

public class HelloWorld : Algorithm
{
    override public string Name => "Hello World Algorithm";

    override public void Run()
    {
        Output.WriteLine("Hello, we're running.");
    }

    public override void Report()
    {
        Output.WriteLine("Hello, here's your report.");
    }
}
First, we add the TuringTrader.SimulatorV2, TuringTrader.SimulatorV2.Indicators, and TuringTrader.SimulatorV2.Assets namespaces, so that we may access TuringTrader's types and classes without having to qualify the use of those types. That will save us a lot of typing and make the code much easier to read.
Next, we derive a new class from Algorithm. We make our class public, so that the simulator can discover it using reflection.
It is good practice to give each algorithm a Name. This will make it easier to tell you algorithms apart later.
The Run mehtod is the where we implement all of our algorithm's logic: initialization, data-processing, and cleanup. The simulator calls Run only once over the lifetime of an algorithm object. That way, we can be minimalistic with initialization and cleanup.
The Report method is where we render a report to present the algorithm's outcome. TuringTrader can create reports in many different ways, based on user-definable templates, allowing you to create any report format you see fit. Most users will start with native output the screen, but TuringTrader can also create reports in Excel, R, and R Markdown.
Simulation Range
Now that we have a dummy algorithm, it is time to add some useful functionality to the Run method. The first thing any algorithm should do is to specify its simulation range. The relevant code looks like this:
StartDate = DateTime.Parse("2015-01-01T16:00-05:00");
EndDate = DateTime.Parse("2016-12-31T16:00-05:00");
WarmupPeriod = TimeSpan.FromDays(50);
By setting the StartDate and EndDate, we set the range we are looking to simulate.
Unfortunately, many indicators need additional history, in order to initialize and settle for accurate values. This period is called warmup and can be quite long, depending on the indicators used. With TuringTrader, you can specify the length of the warmup period with the WarmupPeriod property. Note that this period is expressed in calendar days, as opposed to trading days.
Processing Bars and Trading Calendar
TuringTrader runs its simulations bar by bar, with one bar typically equating to one day. Unlike other simulators, the code explictly instantiates the simulation loop using SimLoop. The relevant code looks like this:
SimLoop(() =>
{
    // your code here
});
The code inside of SimLoop is called exactly once for every bar between StartDate and EndDate. The creation of bars is guided by TuringTrader's TradingCalendar. The default trading calendar matches the schedule of US stock exchanges, trading from Mondays to Fridays from 9:30am to 4:00pm, in the US East Coast (America/New York) time zone. The TradingCalendar will skip holidays as required.
It is worth pointing out that TuringTrader runs in your local time zone. The TradingCalendar translates back and forth the US East Coast time zone and your local time zone. In case you are not trading at US stock exchanges, you can replace the default TradingCalendar with a custom calendar that matches your needs.
Importing Asset Quotes
Regardless how simple you trading algorithm might be, you will need to import asset quotations. In TuringTrader, you bring in quotes using the Asset method. The relevant code looks like this:
var asset = Asset(ETF.SPY);
Asset takes a single parameter, the asset's nickname. Most often, the nickname is the asset's ticker symbol, as used by your datafeed. However, TuringTrader has powerful features to map ticker symbols, add backfills, and manage multiple datafeeds. In this example, we don't use "SPY" to load quotes for the ubiquituous S&P 500 ETF, but ETF.SPY. The latter is a pre-defined asset that includes a backfill for longer history. TuringTrader includes backfills for many ETFs.
You can call the Asset method at any time inside or even outside of the SimLoop. However, you should have proper values for StartDate and EndDate when you do. The first time your code requests an asset quote, TuringTrader will load these data from your datafeed and resample them to match the TradingCalendar. This makes for a worry-free experience when bringing in data that do not follow your exchange's schedule. Examples include macroeconomic indicators, or quotes from other exchanges.
The result of an asset is a TimeSeriesAsset. This is a time series of OHLCV values, plus some additional meta information.
Internally, TuringTrader caches most of its data, including asset quotes and indicator results upon first request. Therefore, subsequent calls to Asset are served from the cache - provided you keep using the same nicknames.
Handling data is a complex topic. We recommend learning more this in our article about data setup.
Calculating Indicators
Once you imported your quotes, you can calculate indicators. TuringTrader provides a range of built-in indicators. If that's not enough, You can also create custom indicators. In any case, using TuringTrader's 'automagic' indicators is much simpler than with most other simulators. Using an indicator is never more than a function call away.
var asset = Asset(ETF.SPY);
var prices = asset.Close;
var ema26 = prices.EMA(26);
var ema12 = prices.EMA(12);
var macd = ema12.Sub(ema26);
var signal = macd.EMA(9);
The code above calculates MACD one indicator at a time. However, you could also write this:
var macd = Asset(ETF.SPY).Close.EMA(12)
    .Sub(Asset(ETF.SPY).Close.EMA(26));
var signal = macd.EMA(9);
Just like with Asset, you can calculate your indicators whereever you need them, inside or outside of the SimLoop. TuringTrader calculates indicators upon the first request and for the full simulation range at once. This calculation is multi-threaded, helping reduce simulation time for indicator-rich strategies, especially when trading large universes.
Accessing Time Series Data
At some point, you will want to access time series data, namely indicator values at specific trading days. Like many other simulators, TuringTrader uses square brackets to do so.
var todaysMACD = macd[0];
var yesterdaysMACD = macd[1];
var lastWeeksMACD = macd[5];
var lastMonthsMACD = macd[21];
var lastYearsMACD = macd[252];
The value inside the square brackets is an offset to the current SimDate. A value of zero is the current bar or 'today'. A value of one is the previous bar or 'yesterday'. These offsets are specified in trading days. Therefore, an offset of five is a week ago, a value of 21 is a month ago, and a value of 252 is a year ago.
var tomorrowsMACD = macd[-1];
It is also possible to look into the future. However, it is important to use this feature mindfully in order to not introduce a data snooping bias into your simulation. Use at your own risk!
Sometimes, it might be difficult to calculate the offset in bars. For these occasions, TuringTrader has another unique feature to offer:
var startingMACD = macd[StartDate];
It is possible to query the value of a timeseries by date. The example above shows how to retrieve the MACD value at the start of the simulation.
Creating Custom Charts
Calculating indicators and running a simulation is not enough - at some point you need to report the data. TuringTrader can render data natively, save them as CSV, or pass them on to Excel and R. All of this is possible through the Plotter object.
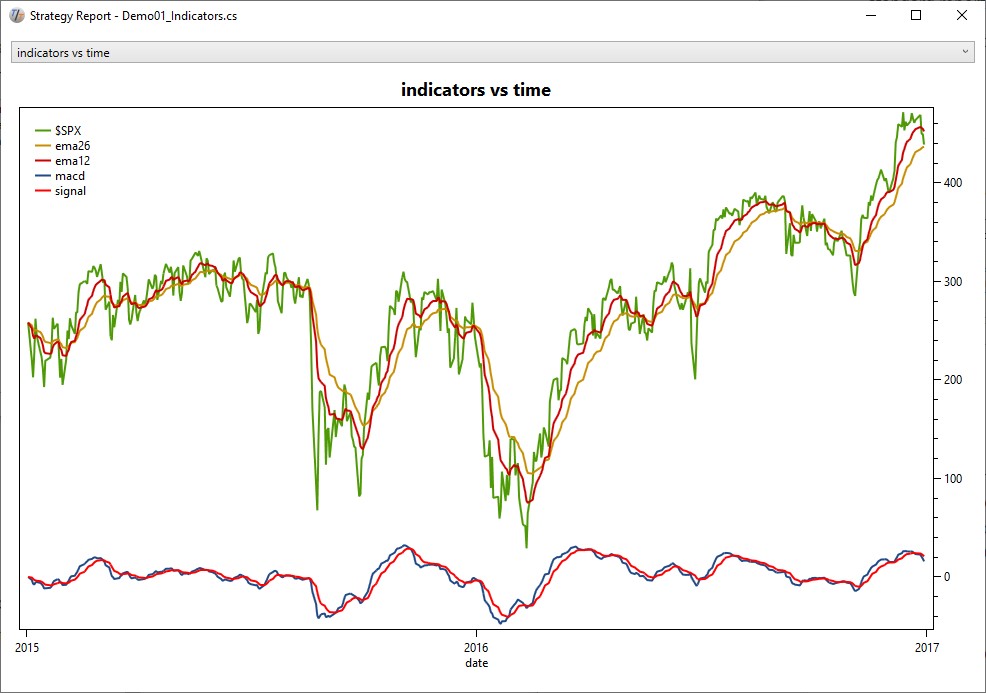
Plotter.SelectChart("indicators vs time", "date");
Plotter.SetX(SimDate);
Plotter.Plot(asset.Description, prices[0]);
Plotter.Plot("ema26", ema26[0]);
Plotter.Plot("ema12", ema12[0]);
Plotter.Plot("macd", macd[0]);
Plotter.Plot("signal", signal[0]);
A Plotter object can hold multiple charts. By calling SelectChart, we select the chart to use, and specify the horizontal x-axis.
With SetX we can set the horizontal value. In this example, we use SimDate, the simulator's current timestamp.
Then, using Plot, we can add one or more lines to the chart. Here, we chart the asset's price along with the 12 and 26-day EMAs, the MACD indicator, and the signal line.
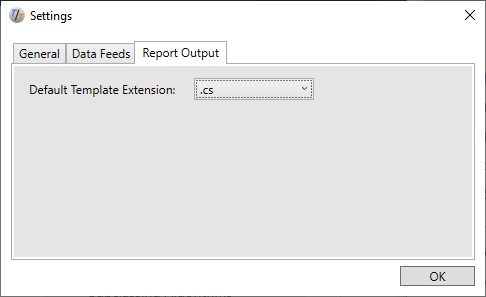
public override void Report() => Plotter.OpenWith("SimpleChart");
The final piece to charting happens in the Report method. The parameter passed into Report refers to a template which controls the appearance. If the template file name does not include an extension, like in this example, the extension used is the Default Template Extension from the Report Output Settings:
Here is how the plot will look like using the native C# template:
There are virtually no limits to the customized reports and plots we can create. The repository contains simple templates, most importantly our SimpleReport template. If that's not enough, you are welcome to create your own, fancier, or more elegant ones. Read this topic to learn more.
This brings us to the end of our first TuringTrader demo. Please find the full code for this demo in our repository.