Option Strategy Risk Graph
This post describes a feature that is only available in the v1 engine. The v2 engine does not support options and likely never will. However, there are no plans to end support of the v1 engine.
In a previous post, we announced TuringTrader’s support for option greeks. Today, we added yet another feature to improve TuringTrader’s option trading capabilities: The ability to calculate an option strategy’s risk graph.
The new functionality is really easy to use, here is a little code snippet, showing how to plot the risk graph of a simple strategy:
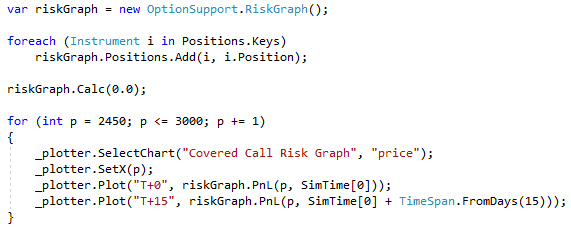
First, we instantiate a risk graph object. Then, we add the desired legs to it, which can be either options, or the underlying. Next, we calculate the graph, which will lock in the current spot price, and the implied volatility. And finally, we query points of the graph, to plot the results.
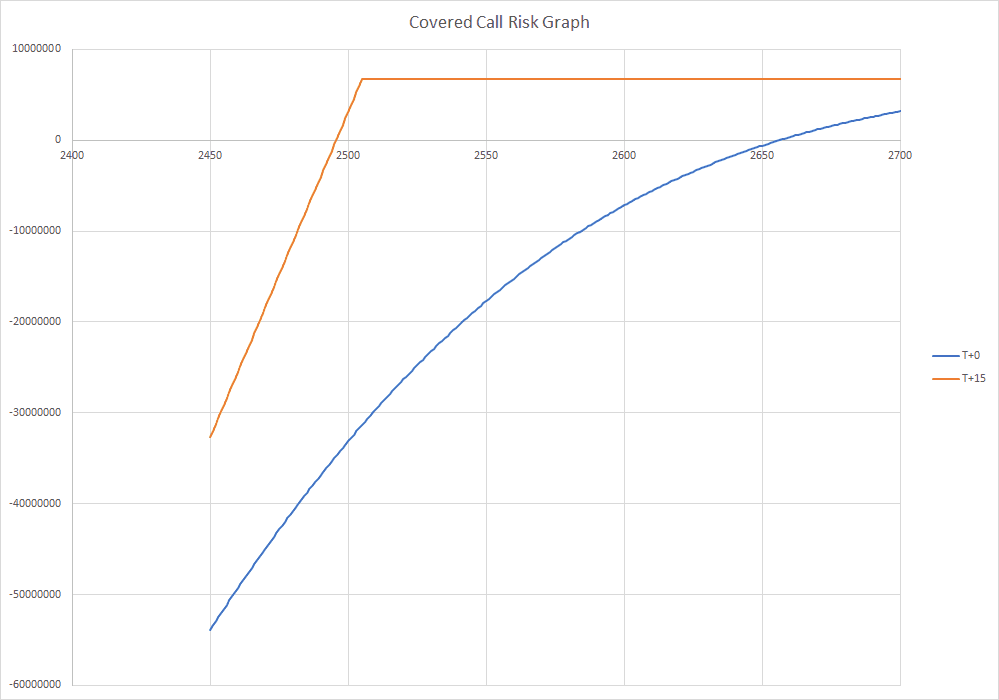
In this example, we created a simple chart for an ITM covered call:
We are using this functionality in some of our own strategies, and will be carefully monitor what else might be required. We’ll probably add some additional support functionality soon to make this even more useful. Stay tuned!
Happy coding!